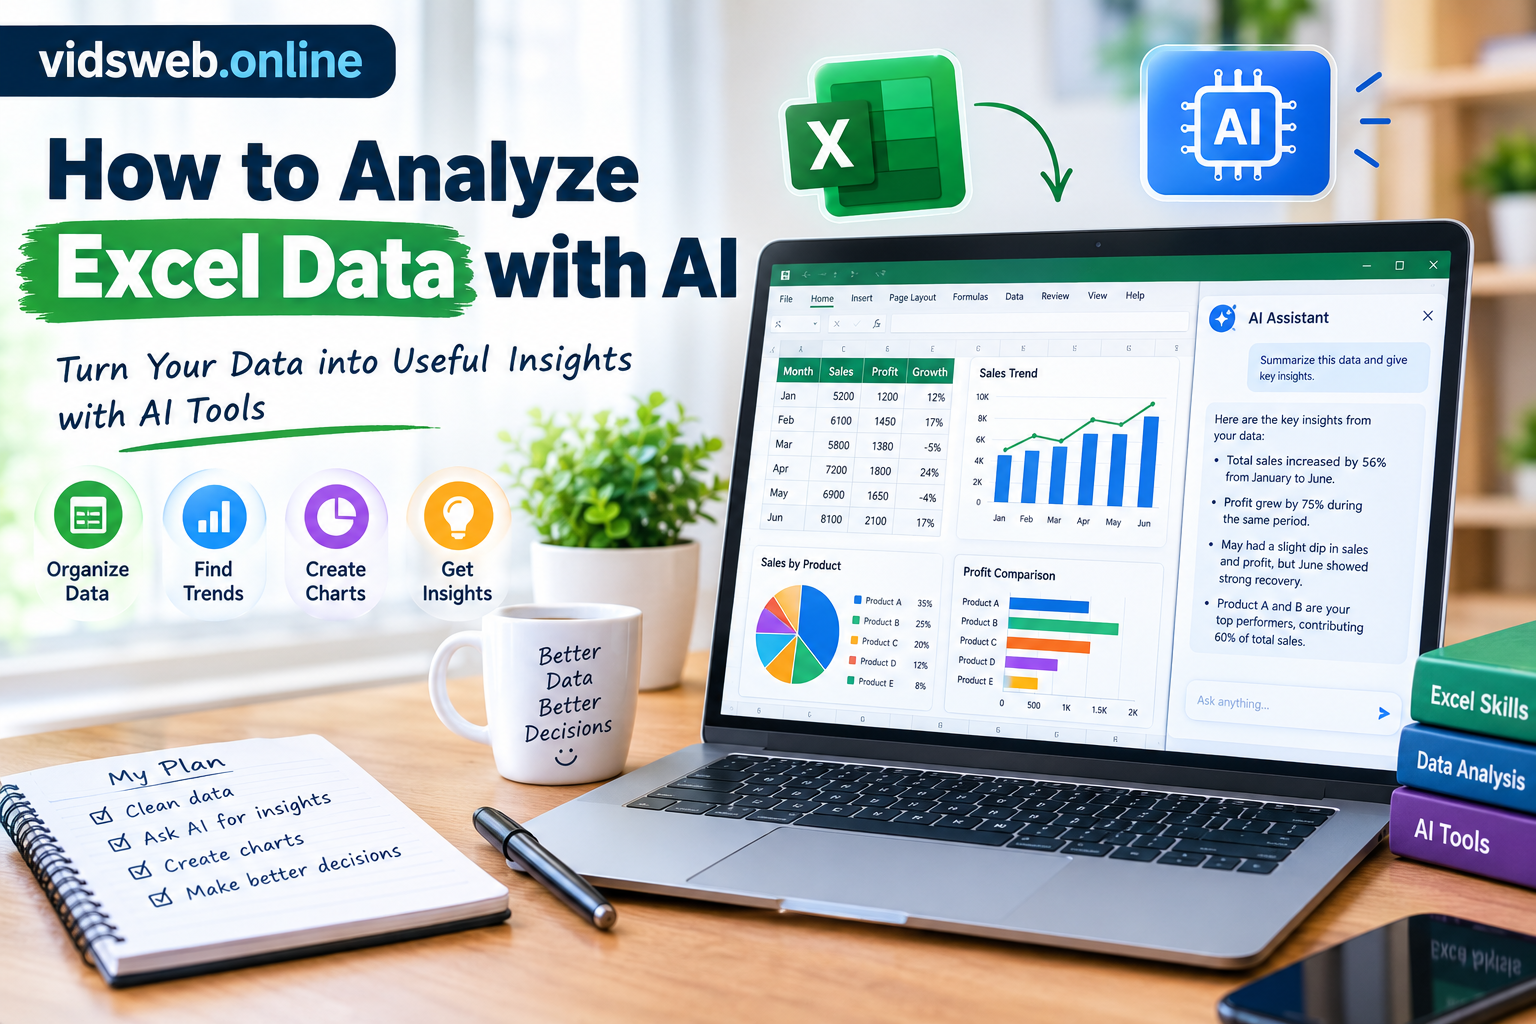
Microsoft Excel is a useful tool for managing sales records, business expenses, budgets, customer information, and other types of data. However, understanding a large spreadsheet can be difficult when you need to identify trends, calculate totals, compare products, or prepare a report.
Artificial intelligence (AI) can help make these tasks easier. Depending on the tool you use, you can ask questions about your data, generate Excel formulas, identify possible errors, create charts, and turn numerical results into understandable summaries.
For example, a small business owner can use AI to explore which products generate the most revenue, compare monthly sales, and identify figures that deserve further investigation.
The key is to use AI as an assistant rather than trusting every answer without checking it. In this guide, you will learn how to analyze Excel data with AI, use practical prompts, verify calculations, and turn spreadsheet information into useful insights.
What Can AI Do with Excel Data?
AI can support several common spreadsheet tasks, although the available features depend on the application, subscription, file format, and data you provide.
Here are some practical examples:
- Summarize data: Understand the main figures in a sales or expense spreadsheet.
- Generate formulas: Get help writing and understanding Excel formulas.
- Find trends: Compare results across products, months, or other categories.
- Check data quality: Identify missing values, possible duplicates, and unusual entries.
- Create charts: Choose suitable visualizations for presenting your findings.
- Prepare reports: Explain verified calculations in clear, simple language.
AI is particularly useful when you know what question you want to answer but are unsure how to perform the analysis.
However, AI cannot guarantee that every calculation or conclusion is correct. Your results still depend on the quality of the data and the way you verify the output.
Which AI Tools Can Help Analyze Excel Data?
You do not need several AI applications to get started. Choose a tool based on your spreadsheet, budget, and requirements.
1. ChatGPT
ChatGPT can help explain formulas, suggest analysis methods, and work with supported spreadsheet files when file uploads and data-analysis features are available to your account.
For example, you can ask it to summarize a sales dataset, compare product revenue, or explain how to calculate monthly growth.
Website: https://chatgpt.com/
2. Microsoft Excel with Copilot
Microsoft Copilot offers AI assistance for supported Microsoft 365 applications and configurations. Depending on your access, it may help you explore spreadsheet data, understand patterns, and work with formulas or visualizations.
Availability and capabilities depend on your Microsoft plan and the specific features enabled for your account.
Website: https://www.microsoft.com/microsoft-365
3. Google Gemini
Google Gemini can help with spreadsheet analysis questions, formula explanations, and data-related tasks through the features available in your account.
The way you provide data and the types of files or integrations supported may vary.
Website: https://gemini.google.com/
Which tool should you choose?
If you already use Excel, start with the features available in your existing Microsoft account. If you want help understanding a dataset or writing formulas, an AI assistant such as ChatGPT or Gemini may also be suitable.
Check current pricing, usage limits, file support, and privacy terms before selecting a tool. You can begin with a small sample dataset rather than paying for a subscription immediately.
Step 1: Prepare Your Excel Spreadsheet
Before asking AI to analyze your data, make sure your spreadsheet is organized.
Consider this example of a small business that records product sales.
| Date | Product | Quantity | Unit Price | Total Sales |
|---|---|---|---|---|
| 2026-01-05 | Product A | 10 | 500 | 5,000 |
| 2026-01-08 | Product B | 6 | 800 | 4,800 |
| 2026-01-12 | Product A | 8 | 500 | 4,000 |
| 2026-02-03 | Product C | 5 | 1,200 | 6,000 |
| 2026-02-10 | Product B | 9 | 800 | 7,200 |
This sample contains five transactions and can be used to practice basic sales analysis.
Before uploading or sharing your spreadsheet, follow these steps:
- Use clear column headings. Choose labels such as Date, Product, Quantity, and Total Sales.
- Keep data consistent. Use a consistent format for dates, quantities, and prices.
- Check missing values. Identify empty cells that might affect calculations.
- Review duplicate records. Determine whether repeated rows are genuine transactions or accidental duplicates.
- Check formulas. Confirm that sales totals match quantity multiplied by unit price.
- Protect sensitive information. Remove unnecessary customer details and confidential business data before sharing the file with an external service.
A well-organized spreadsheet helps you ask clearer questions and makes the results easier to verify.
Step 2: Ask AI to Summarize Your Data
Start with a simple overview before moving to more complex analysis.
If your chosen tool supports spreadsheet uploads, provide the prepared file. Otherwise, you can paste a small sample of the data or ask for instructions on how to perform the analysis in Excel.
Use this prompt:
Copy-and-paste prompt:
“Analyze the sales data I provided. Calculate total revenue and total quantity sold. Summarize revenue by product and identify which product generated the highest revenue and which product sold the most units. Show the calculations used, explain any assumptions, and do not invent missing information.”
This prompt is more useful than simply asking AI to analyze a file because it defines exactly what you want to know.
For the sample dataset above, the expected results are:
| Product | Quantity Sold | Total Revenue |
|---|---|---|
| Product A | 18 | 9,000 |
| Product B | 15 | 12,000 |
| Product C | 5 | 6,000 |
| Total | 38 | 27,000 |
In this example, Product B generates the highest revenue, while Product A has the highest quantity sold.
This distinction matters. A product that sells more units does not necessarily generate the most revenue.
Use the table as a reference when checking AI’s calculations. If the results differ, investigate the discrepancy before using the analysis.
Step 3: Use AI to Generate Excel Formulas
Excel formulas perform calculations automatically, but beginners may not always know which formula to use.
AI can suggest a formula and explain how it works.
For the sample spreadsheet, assume that:
- Column A contains dates.
- Column B contains product names.
- Column C contains quantities.
- Column D contains unit prices.
- Column E contains total sales.
Here are some useful formulas.
Calculate total sales
=SUM(E2:E6)
This adds the sales values in cells E2 through E6. For the sample dataset, the result is 27,000.
Calculate average transaction value
=AVERAGE(E2:E6)
This calculates the average sales value across the five transactions, giving 5,400.
Calculate the total quantity sold
=SUM(C2:C6)
The result is 38 units.
Calculate sales for Product A
=SUMIF(B2:B6,"Product A",E2:E6)
This adds the sales values for rows where the product name is Product A. The result is 9,000.
You can ask AI to adapt a formula to your own spreadsheet.
Formula prompt:
“My Excel spreadsheet contains product names in column B and sales values in column E. Write a formula to calculate the total sales for Product A. Explain each part of the formula and show me how to test the result.”
Always check the column letters and row numbers before using a suggested formula. Test it on a small range with known results before applying it to a larger workbook.
Step 4: Identify Trends and Compare Results
Once you understand the overall figures, investigate how your data changes across time or categories.
A business might want to know whether monthly revenue is increasing, which products are performing well, or which months require further investigation.
AI can help you choose the right comparisons and interpret calculations you provide.
Try this prompt:
“Analyze the monthly sales figures in my spreadsheet. Identify the highest and lowest sales months, calculate the percentage change between consecutive months, and summarize the main patterns. Separate confirmed findings from possible explanations.”
For example, suppose sales increased from 100,000 in January to 120,000 in February.
The percentage increase is 20%.
In Excel, if January sales are in cell B2 and February sales are in cell B3, use:
=(B3-B2)/B2
Format the result as a percentage. This formula assumes the earlier value is not zero.
If the starting value is zero, percentage growth cannot be calculated using this formula. You should report the change in absolute terms instead.
Remember that a trend does not automatically explain why something happened. If sales fall in a particular month, you need additional information to determine the reason.
Step 5: Create Charts with AI Assistance
Charts help readers understand data without examining every row in a spreadsheet.
AI can recommend a chart type, explain how to create it, and, where supported, help generate visualizations directly.
Choose a chart according to the information you want to communicate.
- Column chart: Compare sales across products or months.
- Line chart: Show changes over time.
- Bar chart: Compare categories with long labels.
- Pie chart: Display a small number of categories as parts of a meaningful whole.
- Scatter chart: Explore the relationship between two numerical variables.
For example, a column chart can compare total revenue from Products A, B, and C.
Use this prompt:
“Recommend an appropriate Excel chart for comparing total revenue across products. Explain why the chart is suitable and give me step-by-step instructions for creating it using my spreadsheet.”
After creating the chart, verify that the labels, values, units, and categories are correct.
Avoid adding too many visual effects. A simple chart with a clear title and readable labels is often more useful than a complicated dashboard.
Step 6: Find Missing Values and Possible Errors
Incorrect data can lead to misleading conclusions, even when the formulas themselves are correct.
AI can help you identify possible problems, such as:
- Missing product names or dates.
- Negative quantities that require investigation.
- Duplicate transaction identifiers.
- Inconsistent date formats.
- Sales totals that do not match quantity multiplied by unit price.
Ask AI to review your dataset and recommend checks.
Data-cleaning prompt:
“Review the structure of my spreadsheet and suggest ways to identify missing values, possible duplicate transactions, inconsistent dates, and sales totals that do not match quantity multiplied by unit price. Explain the checks I should perform and flag records for review rather than automatically deleting or changing them.”
Do not assume every unusual value is an error. Negative quantities may represent product returns, while repeated product names may simply represent separate purchases.
Keep a backup of your original file and verify suspicious records against the original source before making changes.
Step 7: Turn Your Analysis into a Useful Report
After completing your calculations, you may need to share the results with a manager, colleague, or business partner.
AI can help turn verified figures into a concise report that explains what the data shows.
A simple sales report might include:
- Total revenue and quantity sold.
- Products with the highest and lowest revenue.
- Changes in sales across the selected period.
- Data-quality issues requiring attention.
- Questions that deserve further investigation.
Use this prompt:
“Prepare a short business report based on the verified calculations from my spreadsheet. Explain the main findings in simple English, highlight important differences between products, and suggest three questions to investigate next. Do not invent figures or claim that the data proves a cause.”
Review every figure before sharing the report. Make sure recommendations are clearly separated from confirmed results.
For example, a report may show that Product B generated the most revenue. It does not, by itself, prove why customers purchased that product or whether its profit margin was the highest.
Common Mistakes to Avoid When Analyzing Excel Data with AI
AI can save time, but several mistakes can reduce the quality of your analysis.
Using vague prompts: Instead of saying “Analyze this file,” specify the calculations, comparisons, and output you need.
Trusting every answer: Verify important totals, formulas, and percentages directly in Excel.
Ignoring data quality: Missing values, inconsistent formats, and duplicate records can affect results.
Confusing revenue with profit: Revenue is the amount earned from sales before expenses. Profit requires accounting for relevant costs.
Assuming correlation proves causation: Two figures changing together does not establish that one caused the other.
Sharing sensitive data: Remove unnecessary personal information and follow your organization’s privacy and data-handling policies before using external AI services.
Making decisions without checking the evidence: Treat AI-generated conclusions as suggestions to investigate, not as unquestionable facts.
Frequently Asked Questions
Can I analyze Excel data with AI for free?
Some AI services offer free access that may be sufficient for basic spreadsheet questions and small datasets. File uploads, advanced analysis, and usage limits vary, so check the current terms of the tool you choose.
Can ChatGPT analyze an Excel file?
ChatGPT can work with supported spreadsheet files when file uploads and data-analysis features are available to your account. You should still verify important calculations against the original spreadsheet.
Do I need advanced Excel skills to use AI?
No. Beginners can use AI to understand formulas, learn basic analysis techniques, and get instructions for creating charts. Basic spreadsheet knowledge helps you check the results and recognize mistakes.
Can AI create Excel formulas?
Yes. AI can suggest formulas based on your requirements and explain how they work. You may need to adjust cell references and ranges to match your spreadsheet.
Is AI accurate enough for business data analysis?
AI can be helpful, but it can also misinterpret data or make calculation errors. Verify important figures and review the assumptions behind any recommendations before using them for business decisions.
Is it safe to upload Excel files to AI tools?
Safety depends on the information in your file and the service’s data-handling policies. Remove unnecessary personal or confidential information and review the privacy settings before uploading sensitive business data.
Final Thoughts
Learning how to analyze Excel data with AI can help you understand spreadsheets, write formulas, identify patterns, create charts, and prepare reports more efficiently.
Start with clean data and a specific question. Use AI to guide your analysis, then check the calculations and investigate unusual results before drawing conclusions.
You do not need to automate everything at once. Begin with a small spreadsheet, test one useful prompt, and gradually expand your skills as you become more comfortable.
When you combine AI assistance with reliable calculations and careful judgment, Excel becomes a more effective tool for turning raw data into useful insights.
Published by vidsweb.online — practical guides to AI tools and technology.